
| WTT User's Guide | ||
|---|---|---|
| Previous | Web Application Interface | Next |
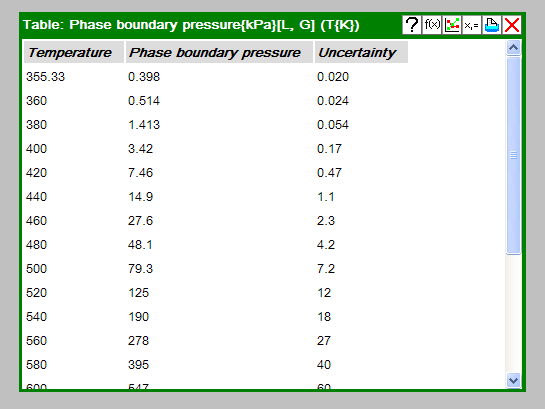
Results from calculations requested with the Range Specification window are displayed in the Data Table window. [Note: Only one calculated result can be displayed at a time]. Data can be sorted by clicking on the column headings. A first click sorts in ascending order and a second sorts in descending order.
In general, the Window Toolbar for a Data Table window contains buttons to access the
associated Range Specification ( ), Graphical Plot (
 ), and Model Summary (
 ).
[Note: The Data Table will not contain numerical data until a calculation is
requested by clicking the Calculate button in the Range Specification window.]
).
[Note: The Data Table will not contain numerical data until a calculation is
requested by clicking the Calculate button in the Range Specification window.]
| Previous | Home | Next |
| Specifying Ranges for a Data Table | Up | Plot Features |
©2012 copyright by the US Secretary of Commerce on
behalf of the United States of America. All rights reserved.
Privacy Policy/Security Notice/Accessibility Statement/Disclaimer/Freedom of Information Act (FOIA)
The TRC Group is part of the Thermophysical Properties Division in NIST's Material Measurement Laboratory
The National Institute of Standards and Technology is an agency of the U.S. Department of Commerce