
| WTT User's Guide | ||
|---|---|---|
| Previous | Web Application Interface | Next |
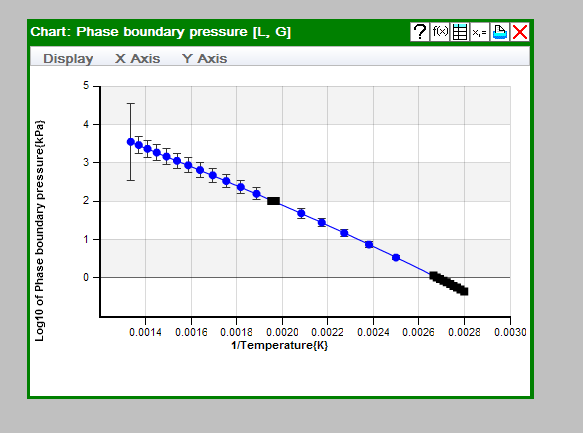
Recommended values be view graphically in the Graphical Plot window. [Note: The window uses Adobe Flash† technology for display; if an appropriate plug-in is not installed on the client computer, plotting is not possible.] If the recommended model has underlying experimental or predicted data of the same type, these will be plotted on the chart for comparison. The property value and associated reference can be viewed by hovering the mouse cursor over a point of interest. Experimental data are displayed as black squares and predicted values are displayed as blue circles. On multi-dimesional plots, data are displayed in deviation plots only. A region on the plot can be magnified up to forty times by clicking and dragging across a region of interest.
In order to manipulate the plot, window-specific menus are available. Not all options below are available on every plot. Unsupported features will either be "grayed out" or not present in the menus. The menus and their possible contents are:
†Certain commercial equipment, instruments, or materials are identified in this documentation only to specify system requirements. Such identification does not imply recommendation or endorsement by the National Institute of Standards and Technology, nor does it imply that the materials or equipment identified are necessarily the best available for the purpose.
| Previous | Home | Next |
| Data Table Features | Up | Interpreting a Model Summary |
©2012 copyright by the US Secretary of Commerce on
behalf of the United States of America. All rights reserved.
Privacy Policy/Security Notice/Accessibility Statement/Disclaimer/Freedom of Information Act (FOIA)
The TRC Group is part of the Thermophysical Properties Division in NIST's Material Measurement Laboratory
The National Institute of Standards and Technology is an agency of the U.S. Department of Commerce